
Grafana Extension - Documentation
Grafana Open Source Software enables you to query, visualize, alert on, and explore your metrics, logs, and traces wherever they’re stored.
The Grafana extension in ServiceDesk Plus Cloud allows you to receive alerts and automatically create incident tickets with metadata, and track all notifications triggered for the same alerts.
Role Required
SDOrgAdmin
Benefits
- Automatic incident creation: No manual effort needed when Grafana detects an issue; incidents are instantly logged in SDP.
- Reduced MTTA/MTTR: Faster detection-to-ticket workflow shortens time to acknowledge and resolve.
- Optional auto-resolution: Resolved Grafana alerts can resolve SDP incidents automatically, reducing manual clean-up.
- Configurable settings: Admins can turn off auto-resolve based on user workflow.
- Idempotent ticketing: Prevents duplicate incidents for the same alert, keeping the queue clean.
- Standardized severity mapping: Grafana alert severities are automatically aligned with SDP priorities.
- Enriched context: Tickets include labels, annotations, dashboard links, timestamps, and alert values giving full insight of the alert trigger.
Set Up Grafana Extension
In ServiceDesk Plus Cloud:
- Go to
Setup > Apps & Add-ons > Extensionsand install the Grafana extension. Alternatively, you can install the extension from ManageEngine Marketplace. - Go to
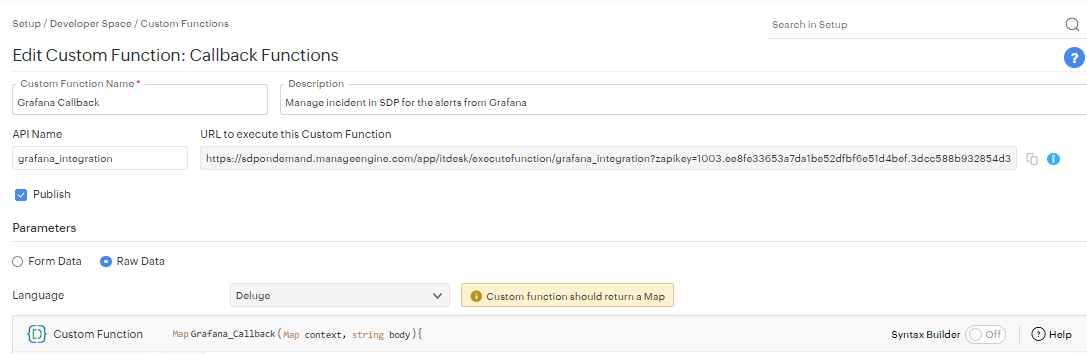
Setup > Developer Space > Custom Functions > Callback Functions. - Expand the callback function titled Grafana Callback by clicking it. Copy the execution URL.
In Grafana: Create a Contact Point
- Log in to Grafana (v9+ with Unified Alerting enabled) - Refer to Grafana Documentation.
- Go to
Alerting > Contact points. - Click
+ Add contact point. - Enter a Name (e.g.,
SDP Webhook). - Under Integration type, select
Webhook. - In the URL field, paste your SDP Grafana Callback execution URL.
- Click
Save contact point.
In Grafana: Configure New / Edit an Alert Rule
- Make sure you choose the above saved contact point under Configure notifications and also choose the default payload for alert.
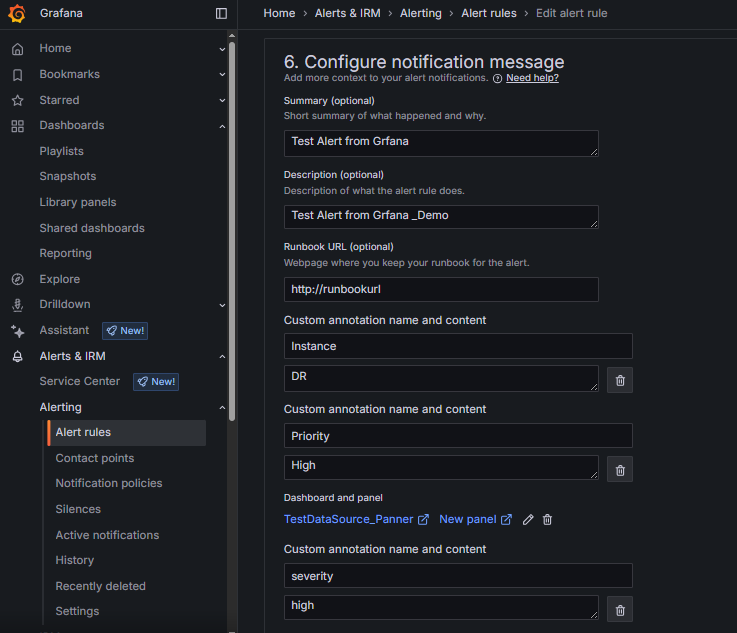
- Add proper notification message details like Summary, Description, and Runbook URL.
- Add the following custom annotations by clicking
Add custom annotationbutton:- Annotation Name:
Instance— value: the instance in which the alert is configured. - Annotation Name:
Priority— value from (Critical, High, Medium, Low, Normal).
- Annotation Name:
In Grafana: Configure Custom Payload
- If mandatory fields are required to create requests in ServiceDesk Plus Cloud, you can configure custom notification template while configuring contact points.
- Go to
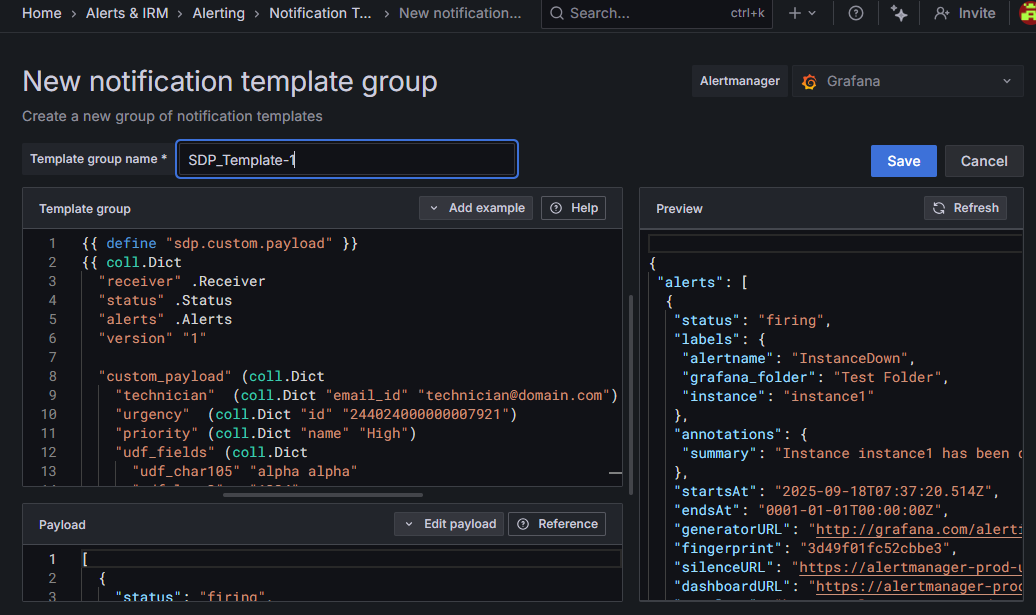
Alerting > Contact points > Notification Templateand click on Add Notification Template Group - Enter a Template group name and use below Template script and save.
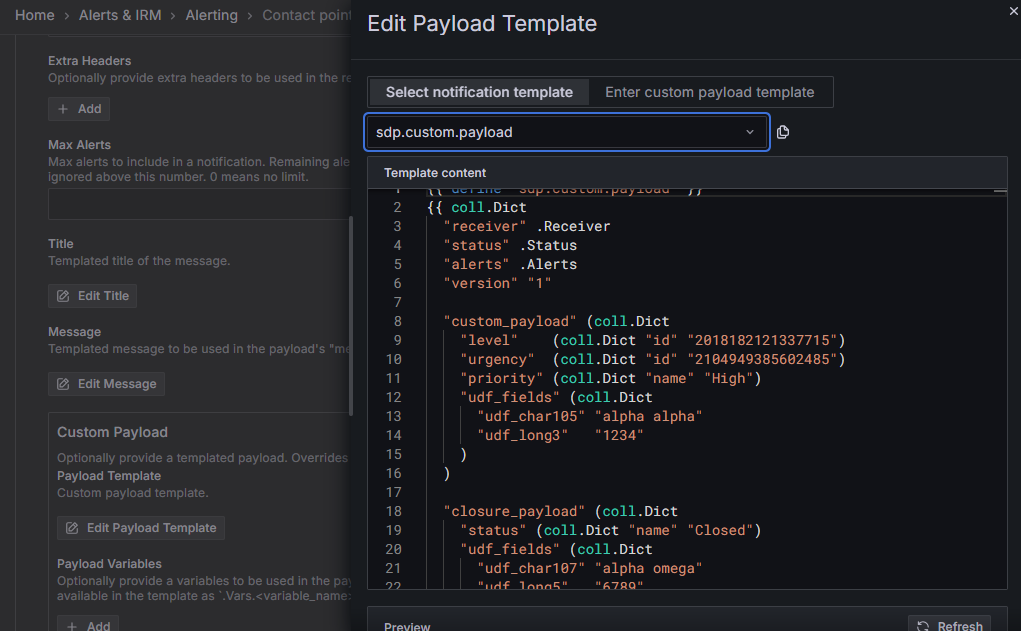
- Edit the contact point go to
Optional Webhook settings > Custom Payload > Edit Payload Templateand select notification template as sdp.custom.payload and save - Make sure to add all the mandatory fields are added under "custom_payload" For example, if the incident template contains mandatory fields such as Techician,Urgency, Priority, and additional fields (e.g., udf_char105 and udf_long3), you can configure these fields within "custom_payload" and all these fields will be mapped to the request created for the firing alert. Note: The fields udf_char105 and udf_long3 mentioned above should match the UDF "Field Keys" present in the instance. Also refer API Documentation to use correct field names
- If request closure rules are mandated in ServiceDesk Plus Cloud, use the "closure_payload" parameter to include the necessary closure information and operations.
- closure_info - Populates fields required by closure rules.
- closure_operation - Sets mode and operation message when a resolved alert recieved from grafana
- closure_operation.mode - Sets mode as notes or resolution.. Based on the selected mode, the closure message is added.
- closure_operation.message - Provides custom message. This message will be prefixed to the note or resolution content.
-- Notification Template Snippet
{{ define "sdp.custom.payload" }}
{{ coll.Dict
  "receiver" .Receiver
  "status" .Status
  "alerts" .Alerts
  "version" "1"

  "custom_payload" (coll.Dict
    "technician"  (coll.Dict "email_id" "technician@domain.com")
    "urgency"  (coll.Dict "id" "244024000000007921")
    "priority" (coll.Dict "name" "High")
    "status" (coll.Dict "name" "Open")
    "udf_fields" (coll.Dict
      "udf_char105" "alpha alpha"
      "udf_long3"   "1234"
    )
  )

  "closure_payload" (coll.Dict
    "status" (coll.Dict "name" "Closed")
    "udf_fields" (coll.Dict
      "udf_char107" "alpha omega"
      "udf_long5"   "6789"
    )
    "closure_info" (coll.Dict
      "requester_ack_resolution" true
      "requester_ack_comments" "Resolved alert received from grafana end"
      "closure_comments" "Issue has been resolved from grafana"
    )
  )

  "closure_operation" (coll.Dict
    "mode" "notes"
    "message" "Issue Resolved - from Grafana"
  )

| data.ToJSONPretty " " }}
{{ end }}
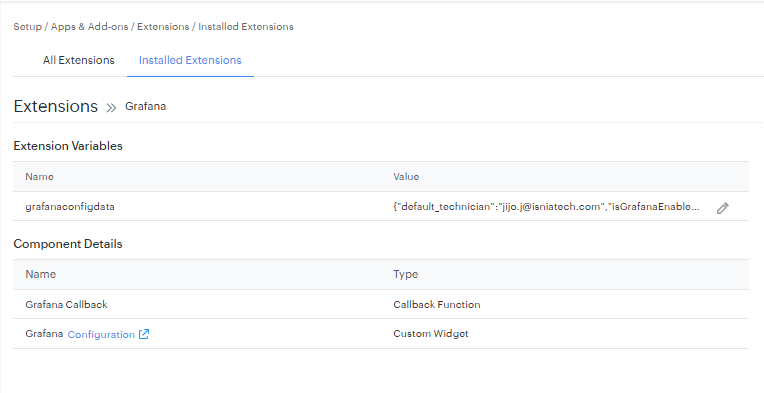
Configure Grafana Extension in ServiceDesk Plus Cloud
- Go to
Setup > Apps & Add-ons > Extensions > Installed Extensions, and open the Grafana extension. - Click Configurations on the Grafana field under Component Details.
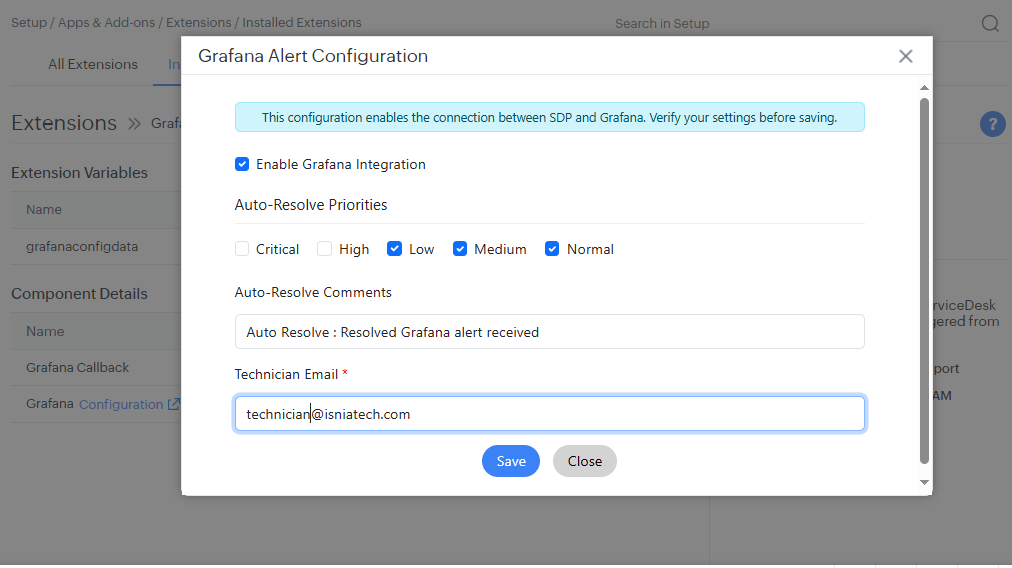
Configure the pop-up with these pointers:
- Enable Grafana extension: Turn on to enable the Grafana integration; you can turn off the integration to stop Grafana alerts to ServiceDesk Plus.
- Auto-Resolve Priorities: Select the alert priorities for which you want to enable incident auto-resolve when a "resolved" alert is received from Grafana.
- Auto-Resolve Comments: Provide comments to update in incident notes when an incident is auto-resolved.
- Technician Email: Provide a valid technician email ID. This will be the default technician assigned during incident creation.Use a custom payload in Grafana when you need to assign different alerts to different technicians
Grafana Tab Views
- Access the Grafana alert details by clicking the three dots (
…) from the tabs and go to the Grafana Alert Details tab. - You will get the list of alerts with all the alerts received for the current alert.
- Access the right side widget for viewing the history of alerts received (latest on the top).
- Use the panel URL to access the Grafana panel for more details from Grafana.
- Once the incident is auto-resolved (if enabled), you can view the auto-resolve comments from the Conversations tab.